Explore 100+ online marketplace statistics for 2026, covering market growth, sales, seller trends, consumer behavior, social commerce, and AI.
Online marketplaces have grown into major shopping destinations, attracting billions of website visits and billions of app downloads worldwide.
For business owners, they mean access to millions of potential buyers, but also growing competition.
Understanding which online marketplaces are growing, where shoppers spend their time, and what influences their purchasing decisions can help you identify the best opportunities.
That's why we've compiled 100+ online marketplace statistics for 2026 covering market growth, sales, seller performance, and more to help you navigate the landscape, reach more customers, and grow your revenue.
Online marketplace statistics highlights
- Online marketplaces accounted for 83.4% of global ecommerce gross merchandise value (GMV) in 2025, up from 81% in 2023.
- Amazon led the global marketplace industry with $845 billion in GMV in 2025.
- 43% of sellers operated across four to six marketplaces in 2026, up from 36% in 2025.
- 98% of online shoppers bought from online marketplaces in 2025.
- 83.4% of online marketplace sellers used AI in at least one area of their business in 2026.
Online marketplace growth statistics
Globally, marketplaces accounted for 83.4% of ecommerce GMV in 2025, up from 81% in 2023, according to a 2026 ECDB report1.
Their growth also varied across regions, with Asia being the most marketplace-led region.
There, marketplaces accounted for 97% of ecommerce GMV in 2025, up slightly from 96.6% in 2023.
Other regions also saw growth:
- Europe recorded the largest increase, from 56.2% in 2023 to 60.8% in 2025.
- The Americas grew from 63.8% to 67.8%.
- Australia and Oceania increased from 50.8% to 53.3%.
- Africa increased from 60.6% to 62.3%.
This growth has come alongside a broader rise in ecommerce activity, driven by four key factors: average order value, the share of purchases that are not returned, how often buyers shop, and the number of buyers.
Notably:
- The number of ecommerce buyers grew by 9% from 2.452 billion in 2023 to 2.673 billion in 2025.
- Average buying frequency went up by around 3.4% from around 13.4 to 13.9 purchases per buyer per year.
- The average ecommerce order value was $146.80, up 2% from $143.90 in 2023.
In the ECDB report, spending patterns also varied by product category and reflect the opportunities available to marketplace sellers.
Across key ecommerce categories, including furniture, groceries, and electronics, the average order value was $169. Furniture and homeware had the highest average order value at $290 in 2025. Meanwhile:
- Groceries had the highest buying frequency at seven purchases per buyer per year, compared with 2.5 for furniture and homeware.
- Electronics had the largest online buyer base at 1.65 billion people, while DIY had the smallest at 445 million.
Online marketplace sales statistics
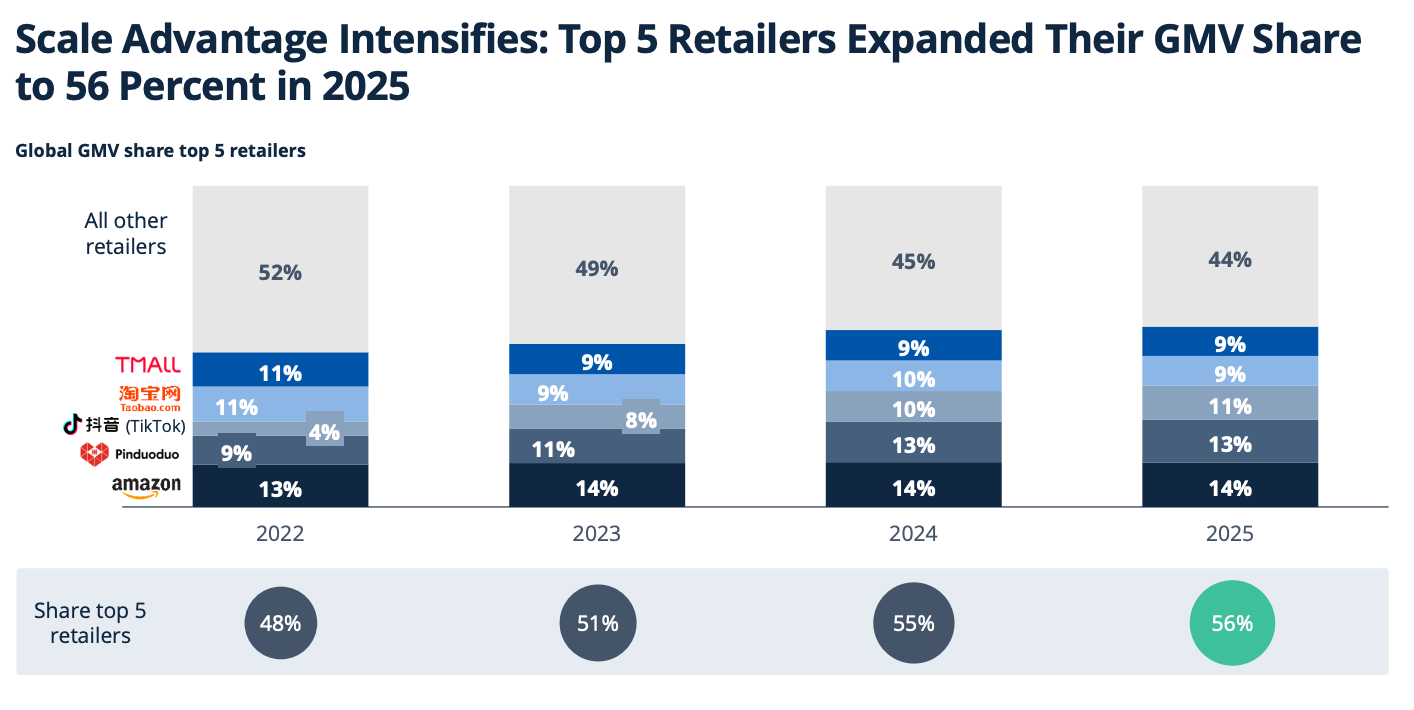
According to the ECDB report, the world’s top 5 online marketplaces increased their GMV share to 56%, up from 48% in 2022.
Of these, Amazon held the largest GMV share at 14%, followed by Pinduoduo at 13%.
The top 10 global marketplaces accounted for 79% of all marketplace GMV in 2025.
This was down slightly from 81% in 2021, while all other marketplaces increased their combined share from 19% to 21%.
Independent merchants selling through a marketplace or third-party sellers generated 84% of marketplace GMV in 2025, up from 81% in 2021.
On the other hand, first-party sales fell from 19% to 16%.
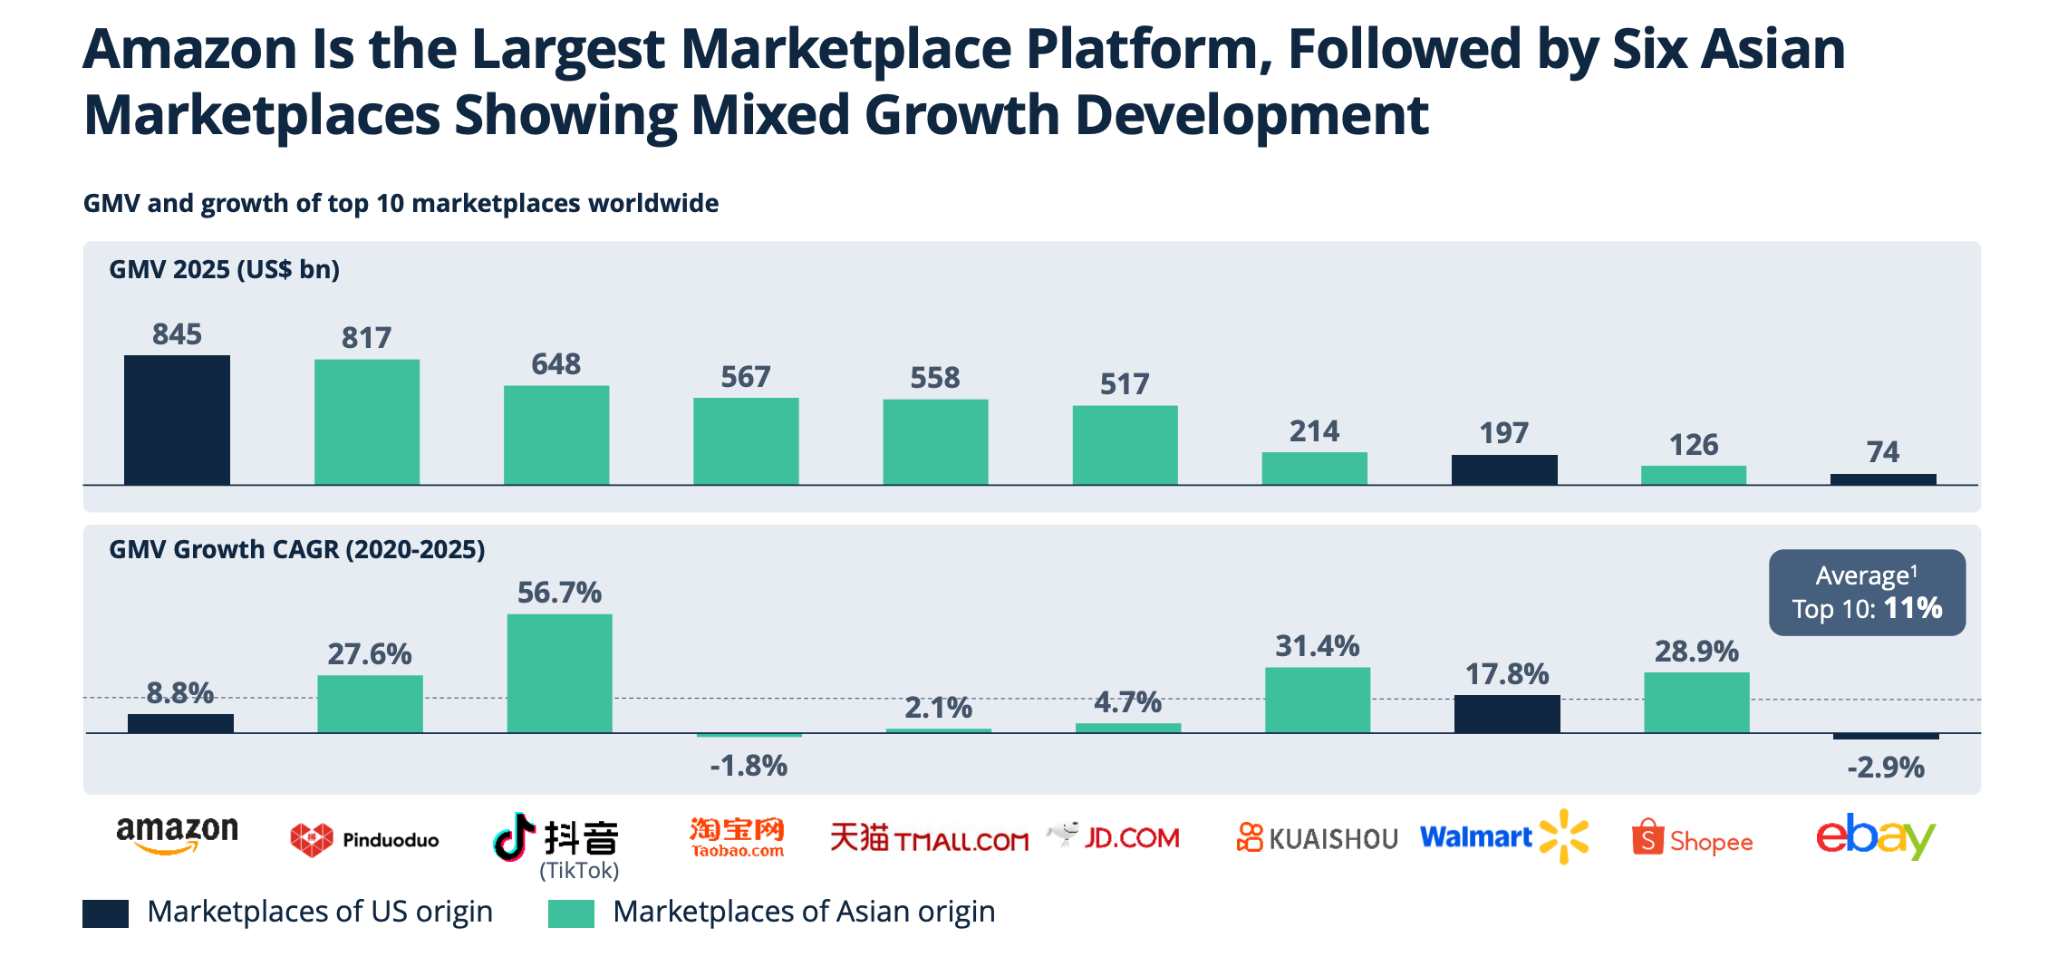
As the largest online marketplace, Amazon generated $845 billion in GMV in 2025.
This was followed by:
- Pinduoduo at $817 billion
- Douyin/TikTok at $648 billion
- Taobao at $567 billion
- Tmall at $558 billion
- JD.com at $517 billion
The top 25% of online marketplaces grew 4.8% faster than the global market.
- At 6%, fashion was the fastest-growing category in North America.
- At 7%, both electronics and fashion were the fastest-growing categories in South America.
- At 3%, the grocery category grew the fastest in Asia.
With a 56.7% CAGR between 2020 and 2025, Douyin/TikTok had the fastest-growing GMV among the top 10 marketplaces.
Kuaishou, Shopee and Pinduoduo also recorded GMV CAGRs above 27% during the same period. On the other hand, Taobao and eBay recorded falling GMVs with CAGRs of -1.8% and -2.9%, respectively.
According to Statista, Amazon accounted for 40.5% of US retail ecommerce sales in 20252.
The market shares of selected online marketplaces were:
- Amazon – 40.5%
- Walmart – 9.2%
- eBay – 2.8%
- Temu – 2.3%
Online marketplace usage statistics
As of October 2026, the top three online marketplaces by website visits were Amazon, Temu, and eBay3.
- Amazon visitors spent an average of 5 minutes and 45 seconds browsing the website, viewing approximately 8.95 pages per visit.
- For eBay, the average visit lasted 5 minutes and 55 seconds, with 6.63 pages viewed per visit.
- Temu visitors spent an average of 4 minutes and 20 seconds on the website, viewing 4.87 pages per visit.
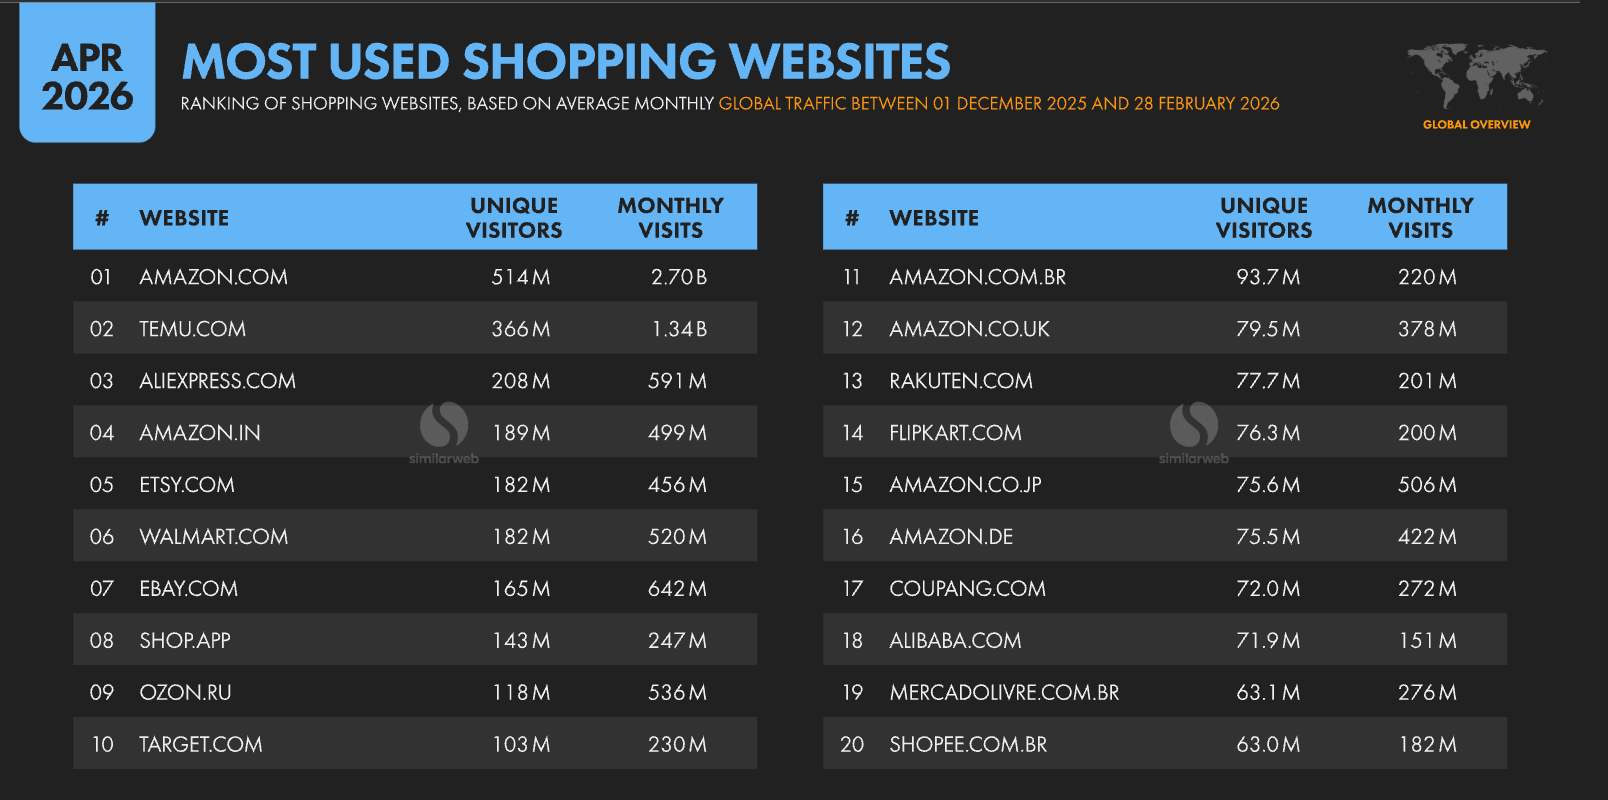
According to DataReportal, Amazon.com was the world's most visited online shopping website, attracting an average of 514 million unique monthly visitors and 2.7 billion monthly visits between December 2025 and February 20264.
Temu ranked second with 366 million unique monthly visitors and 1.34 billion monthly visits, followed by:
- AliExpress.com: 208 million unique visitors and 591 million monthly visits.
- Amazon.in: 189 million unique visitors and 499 million monthly visits.
- Etsy.com: 182 million unique visitors and 456 million monthly visits.
- Walmart.com: 182 million unique visitors and 520 million monthly visits.
- eBay.com: 165 million unique visitors and 642 million monthly visits.
Meanwhile, the most used mobile shopping apps were:
- Amazon
- Temu
- Flipkart
- Shopee
- Shein
In the same report, Walmart was the second-most-popular shopping-related Google search worldwide between March 2025 and February 2026, with a search index of 99.
Searches for Walmart increased by 250% year over year, making it one of the fastest-growing queries among the top 20.
As the largest online marketplace, Amazon ranked fourth among the world's most popular Google shopping searches, with an index of 93.
This was an increase of 20% year over year.
eBay ranked 16th among the top Google shopping searches globally, with an index of 21.
This was an increase of 70% compared with the previous year.
Search interest in ‘deals’ surged by 650% year over year, the largest increase among the top 20 shopping-related Google searches.
The term ranked 11th globally, with a search index of 26.
‘Shoes’ was the most popular shopping-related Google search worldwide, with an index of 100.
Searches increased by 50% year over year, followed by backpacks (+190%) and Coach (+170%) among other fast-growing shopping queries.
In a 2026 Sensor Tower report, global general marketplace app downloads declined by 5.3% year over year in Q1 2026, to roughly 680 million from roughly 720 million.5.
This represents approximately 40 million fewer downloads than in the same quarter of 2025.
Despite fewer downloads, total time spent using marketplace apps increased by 0.4% year over year.
Users spent a combined 1.58 million years on these apps in Q1 2026, compared with 1.57 million years in Q1 2025. This represents approximately 13.8 billion hours of usage during the quarter.
General marketplace apps averaged approximately 7.6 million downloads per day worldwide in Q1 2026.
This is calculated from the estimated 680 million downloads recorded over the 90-day period.
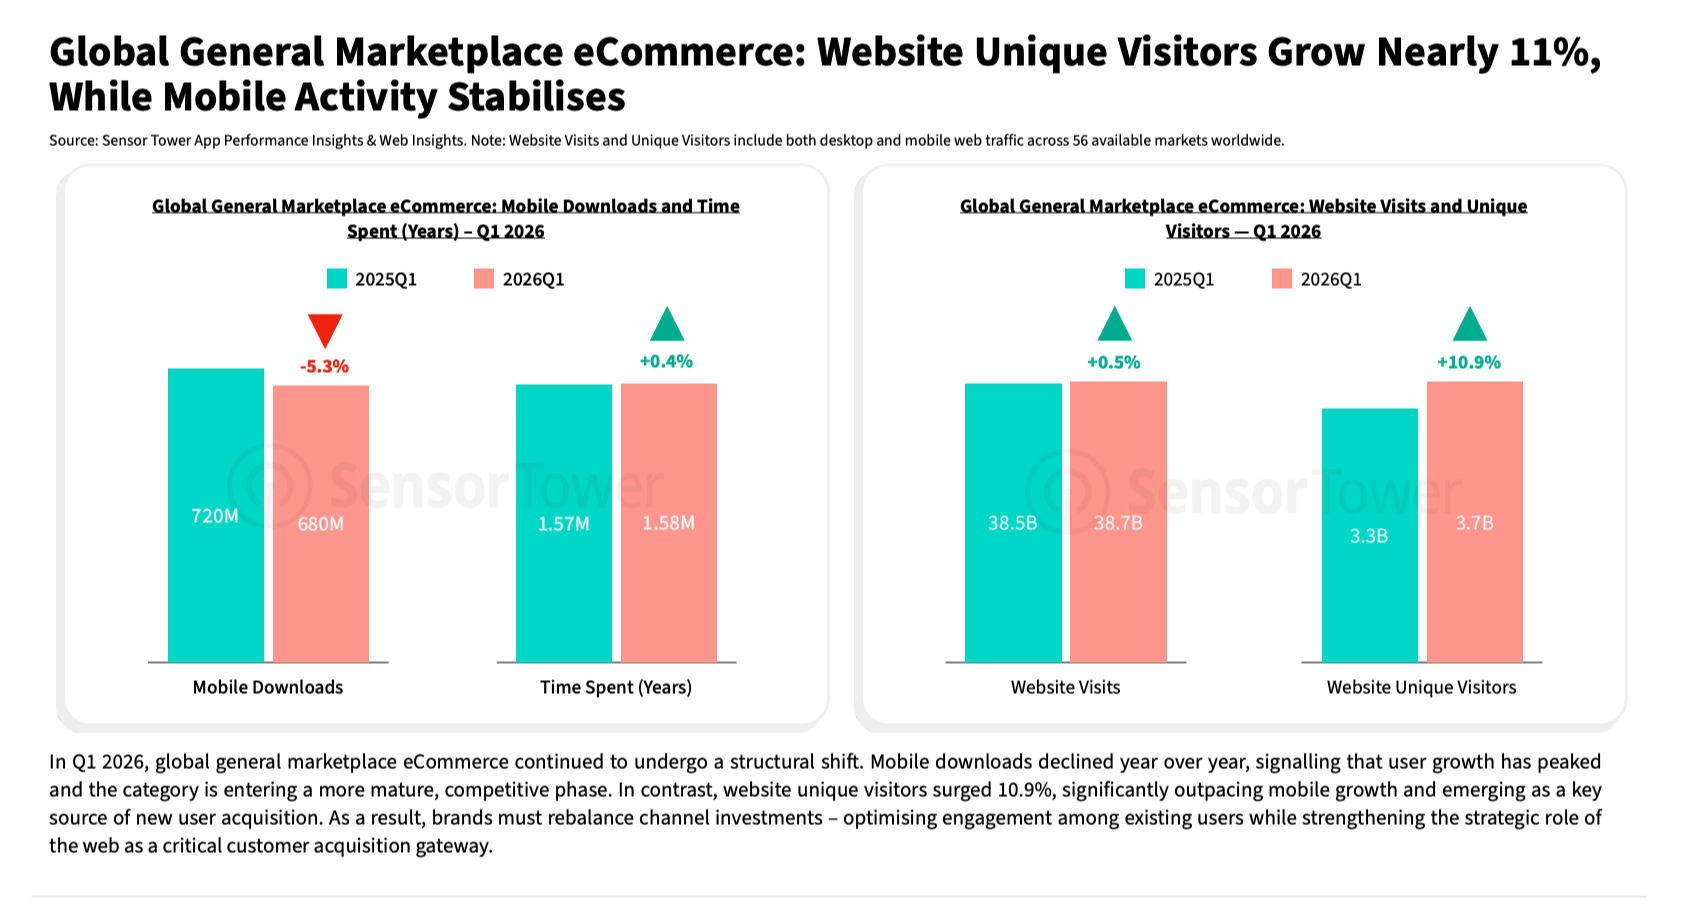
In the same report, global general marketplace websites recorded 38.7 billion visits in Q1 2026, up 0.5% from 38.5 billion in Q1 2025.
This represents approximately 200 million additional website visits year over year.
The number of unique visitors to general marketplace websites increased by 10.9% year over year, reaching 3.7 billion in Q1 2026.
This was up from 3.3 billion in Q1 2025, representing an increase of approximately 400 million estimated unique visitors.
General marketplace websites attracted an average of approximately 430 million visits per day worldwide in Q1 2026.
This is based on 38.7 billion website visits during the 90-day quarter.
Growth in general marketplace website visitors overtook growth in overall website traffic in Q1 2026.
Unique visitors increased by 10.9% year over year, compared with just 0.5% growth in total website visits, a difference of 10.4 percentage points.
While marketplace app downloads declined by 5.3%, website unique visitors grew by 10.9% in Q1 2026.
The difference shows that marketplace website audiences expanded even as new mobile app installations slowed.
In a different 2026 Sensor Tower report, global downloads for online marketplace apps declined slightly to 6.4 billion, down from 6.5 billion in 20256.
The report also found that time spent on online marketplaces increased by 1% year over year.
The report further found that Gen AI referral traffic to major marketplaces surged sevenfold between 2024 and 2025, from around 6 million visits to 41 million.
In the US alone, marketplaces like Walmart and Etsy experienced the most notable growth, with AI-driven referrals increasing by over 1600%.
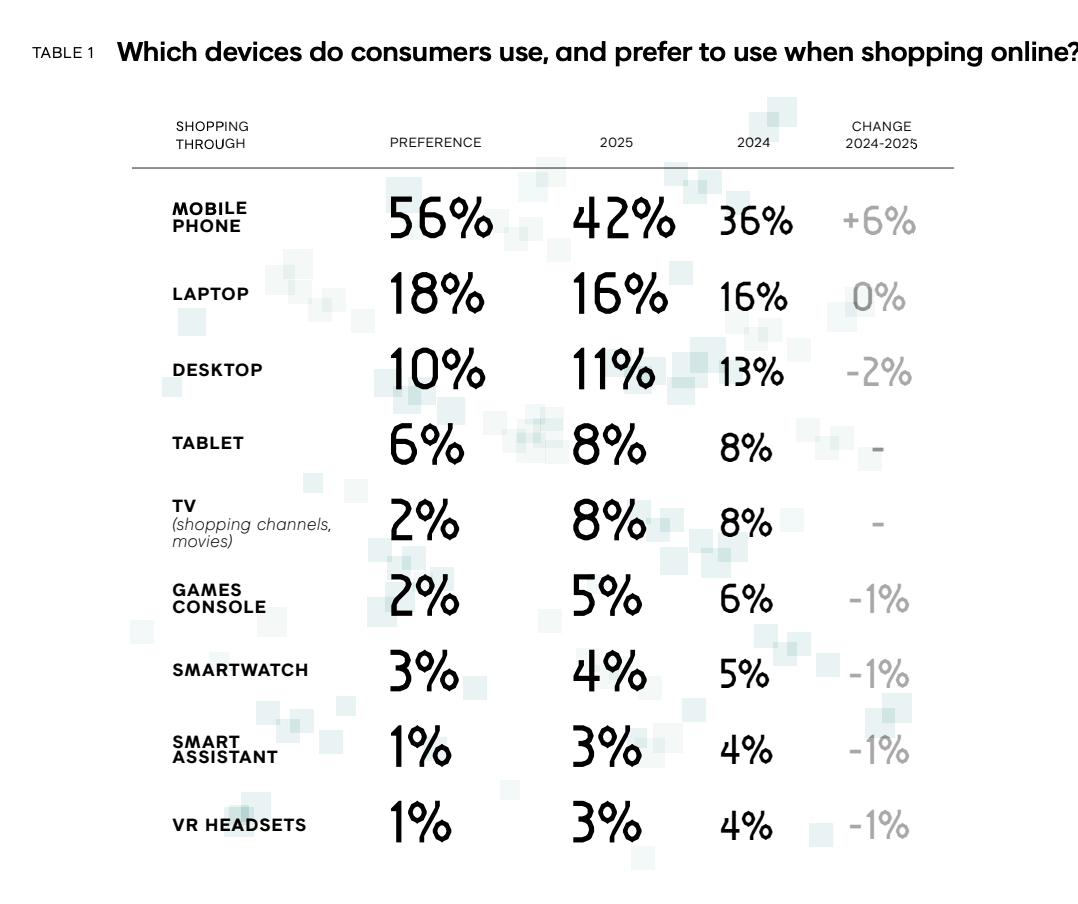
In a 2025 VML report, 42% of all online sales were made via mobile, up from 36% last year7.
56% of shoppers preferred mobile phones, citing reasons like:
- The ability to shop anywhere, any time – 39%
- Easy tracking of orders – 34%
- Faster buying – 31%
- The convenience of saved payment methods – 27%
Meanwhile, laptops were the preferred shopping device for 18% of consumers.
They accounted for 16% of online sales in 2025, unchanged from 2024.
- 10% of consumers preferred shopping on a desktop, and they accounted for 11% of online sales in 2025, down from 13% in 2024.
- Only 6% of consumers preferred shopping on a tablet, and they accounted for 8% of online sales in 2025, unchanged from the previous year.
Online marketplace seller statistics
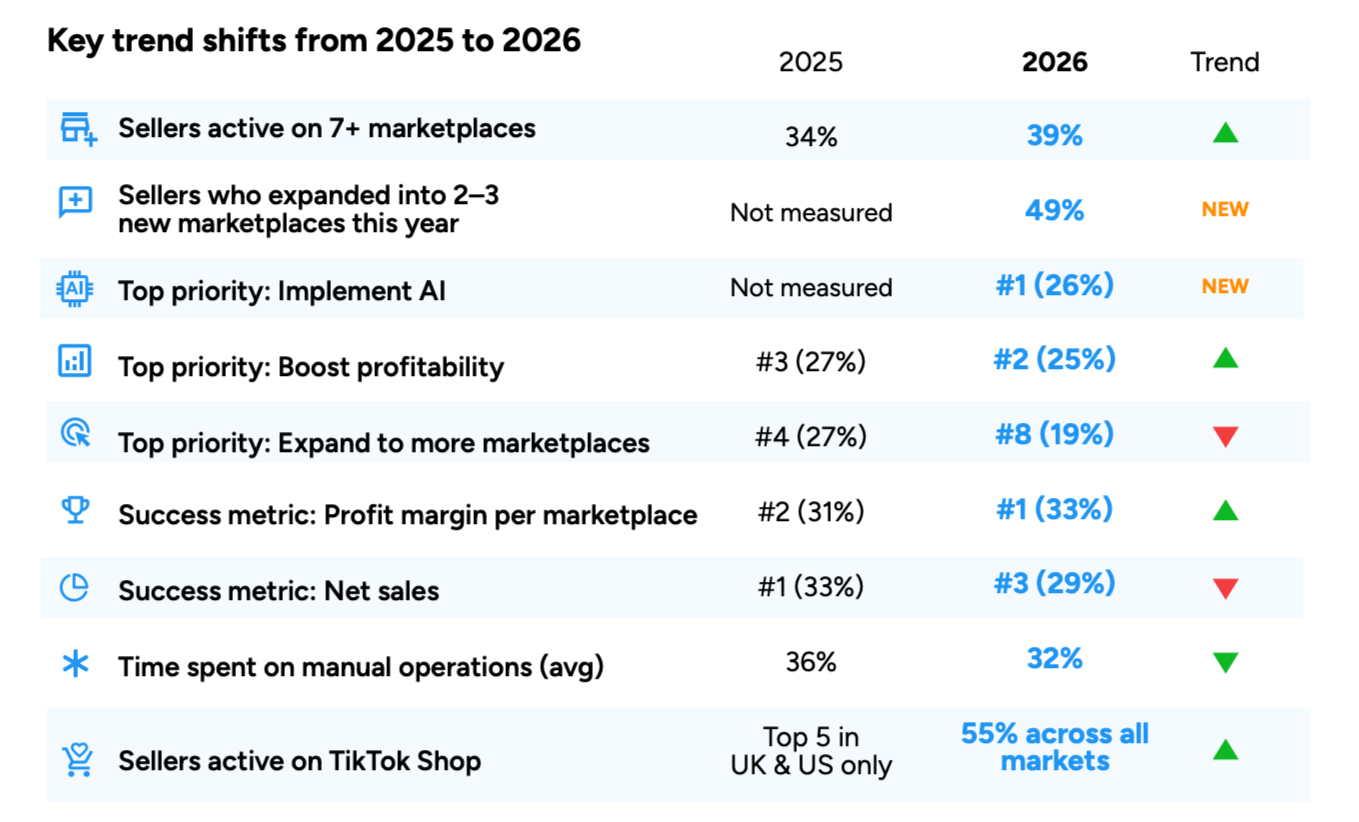
A 2026 ChannelEngine report found that 43% of sellers were active on 4 to 6 marketplaces, up from 36% in 20258.
The number of sellers active on 7 to 10 marketplaces was 39%, up from 34% in 2025.
Meanwhile, when asked about expansion plans, 49% of sellers said they had added 2 or 3 new online marketplaces.
According to the same report, Amazon remained the marketplace of choice across the five countries studied (US, UK, Germany, France and Netherlands).
55% of sellers in these countries were also active on TikTok Shop, reflecting the growth of social commerce as a viable sales channel.
Additionally, AI (26%) and profitability (25%) were sellers' top priorities for the next 12 months.
Other focus areas included:
- Product and content visibility – 24%
- Increasing sales on existing channels – 23%
- Increasing automation – 20%
- Reducing returns or order issues – 19%
The share of time sellers spent on manual marketplace operations decreased slightly from 36% in 2025 to 32% in 2026.
However, nearly 50% of sellers said they still spent 26% to 50% of their working week on manual tasks, with the issue growing as they managed more marketplaces. In fact, sellers managing more than 10 marketplaces spent over half their time on manual operations.
More than 59% of sellers used marketplace integrators or multichannel software to manage product content and pricing.
Sellers also used internal tools and spreadsheets (44%), direct integrations (46%) and manual portal updates.
When asked about the top metrics they tracked for marketplace success, sellers prioritized profit margin per marketplace (33%).
This was followed by average order value 30% and net sales 29%.
The key challenges sellers faced on marketplaces included:
- Incorrect product listings – 45%
- Inconsistent product content across multiple marketplaces – 45%
- Product or price changes not syncing correctly to marketplaces – 42%
- Managing product content across marketplaces – 25%
Sellers reported business consequences including higher operational costs (37%), slower marketplace expansion (34%), and increased listing and pricing errors (33%).
They also reported less time for performance optimization (32%), missed sales opportunities (30%), and slower product launches (29%).
The main external pressures affecting sellers’ margins were:
- Pricing competition – 26%
- Marketplace fees – 23%
- Shipping and fulfillment – 22%
- Rising advertising fees – 21%
Looking beyond borders, 63% of online sellers adapted their stores for each market they served9.
47% also said delivery costs and transit times were the main barriers to cross-border sales.
In a 2026 Marketplace Pulse report, thriving sellers who saw increased revenue and margins operated on just 2.56 platforms on average10.
By contrast, distressed sellers who saw flat or declining revenue and margins averaged 2.96 platforms.
The key platforms sellers actively sold on were:
- Amazon – 92.8%
- Walmart – 48.1%
- eBay – 47.5%
- TikTok Shop – 21%
In the same report, Amazon was the primary revenue source for 82% of sellers.
The remaining 18% was split between DTC/retail channels (7%) and alternative marketplaces (11%). Additionally, 49% said it delivered their highest net profit margins.
Meanwhile, 10% reported earning their highest margins on Walmart, while 26% favored other platforms and 15% reported roughly equal margins across marketplaces.
Further, 48% of online marketplace sellers generated 90% to 100% of their revenue from a single platform.
Another 19% generated 75% to 89% of their revenue from their primary marketplace, while the remaining 33% generated less than 75%.
Nearly half of surveyed online marketplace sellers (46%) generated more than $5 million in annual revenue across all marketplaces.
Another 32% generated between $500,000 and $5 million, while 18% earned less than $500,000.
As of October 2026, online marketplace seller commission rates in the US ranged from 0% to 20%, according to EveryFee11.
Poshmark had the highest commission rate at 20%, followed by Amazon and Walmart at 15% for the categories examined.
At the other end, Vinted and Depop charged no seller commission, although additional fees, such as payment processing, could still apply.
| Platform | Headline rate | Fees on $100 | You keep | Effective fee |
|---|---|---|---|---|
| Vinted | 0% | $0.00 | $100.00 | 0% |
| Shopify | 2.9% + $0.30 | $3.20 | $96.80 | 3.20% |
| Depop | 0% | $3.75 | $96.25 | 3.75% |
| TikTok Shop | 6% | $6.00 | $94.00 | 6% |
| Mercari | 10% | $10.00 | $90.00 | 10% |
| Etsy | 6.5% | $9.95 | $90.05 | 9.95% |
| eBay | 13.6%+ | $14.00 | $86.00 | 14% |
| Amazon FBA | 15% | $15.00 | $85.00 | 15% |
| Walmart | 15% | $15.00 | $85.00 | 15% |
| Poshmark | 20% | $20.00 | $80.00 | 20% |
*Calculated on $100 sale, free shipping for buyers, no paid advertising, US seller, and entry-level selling plan.
29% of surveyed sellers spent 5% to 10% of their gross marketplace revenue on advertising.
Another 23% spent less than 5%, while 18% allocated 11% to 15%. Meanwhile, 15% spent 16% or more, and 13% did not spend anything on marketplace advertising.
Online marketplace consumer behavior statistics
98% of global shoppers bought from online marketplaces in 202512.
Breaking it down by marketplace:
- 59% of shoppers globally bought from Amazon
- 41% of shoppers bought from Temu
- 32% bought from Shein
- 22% bought from Alibaba or AliExpress
- 12% bought from eBay
By country:
- Amazon was the top marketplace in the US for both shoppers (85%) and businesses (87%).
- This was also the case in countries like Canada, Australia, India, and the UAE.
- In China, Taobao was the leading marketplace for shoppers (67%) and businesses alike (77%).
- In Brazil, Shopee was most popular among shoppers (84%) while Mercado Libre was the top marketplace for businesses (86%).
- In South Africa, Takealot was the top marketplace for shoppers (88%) and businesses (87%).
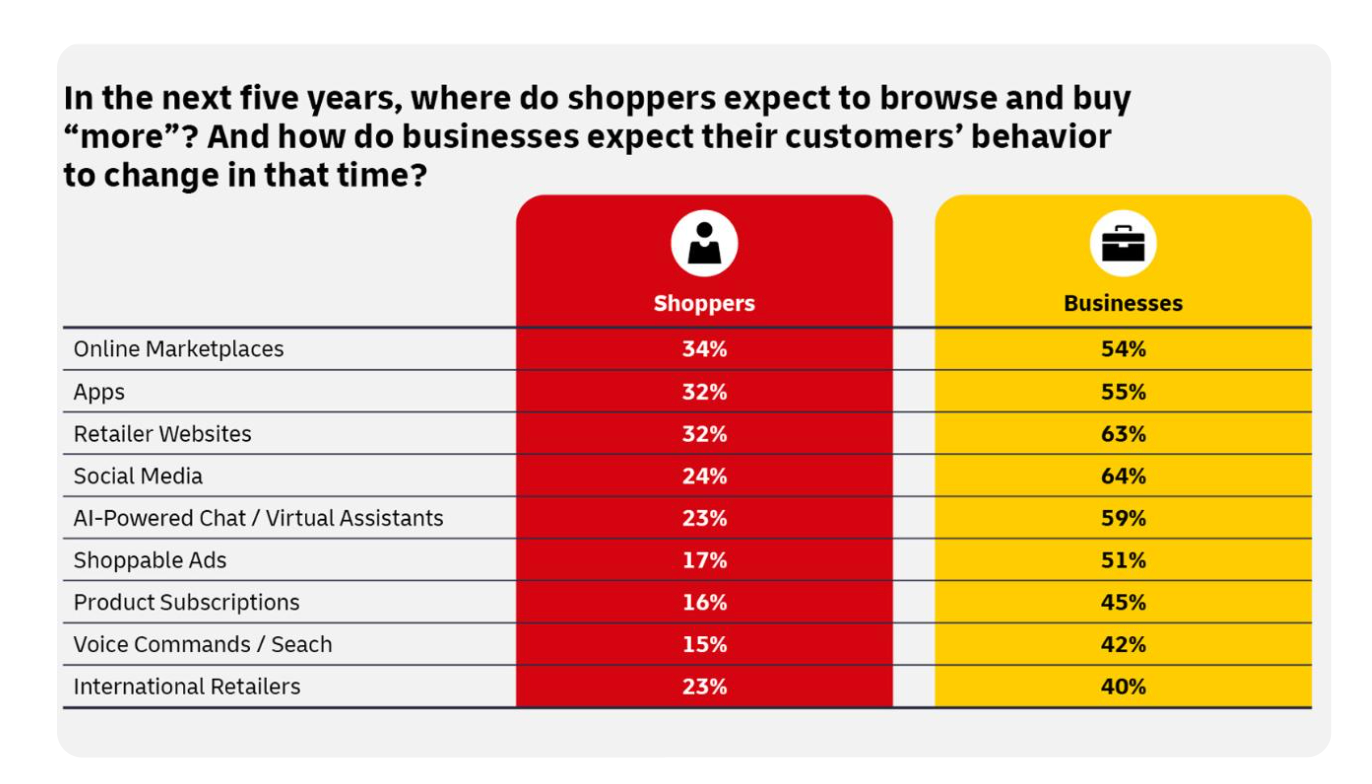
In a separate 2026 DHL report, 34% of online shoppers planned to shop more on online marketplaces13.
Plans to shop more were highest among Gen Z shoppers at 42%, and millennials at 39%.
56.2% of internet users aged 16 and older purchased products and services online in 202514.
This was an increase of 2.5% year over year.
In the same report, 59.6% preferred to shop online rather than in a physical store.
This preference was particularly common among men and women aged 35 to 44.
Women aged 35 to 44 were also the most frequent weekly online shoppers, with 60.4% purchasing something online each week.
Women aged 45 to 54 had the second-highest weekly online shopping rate at 59.7%, compared with 56% of men in the same age group.
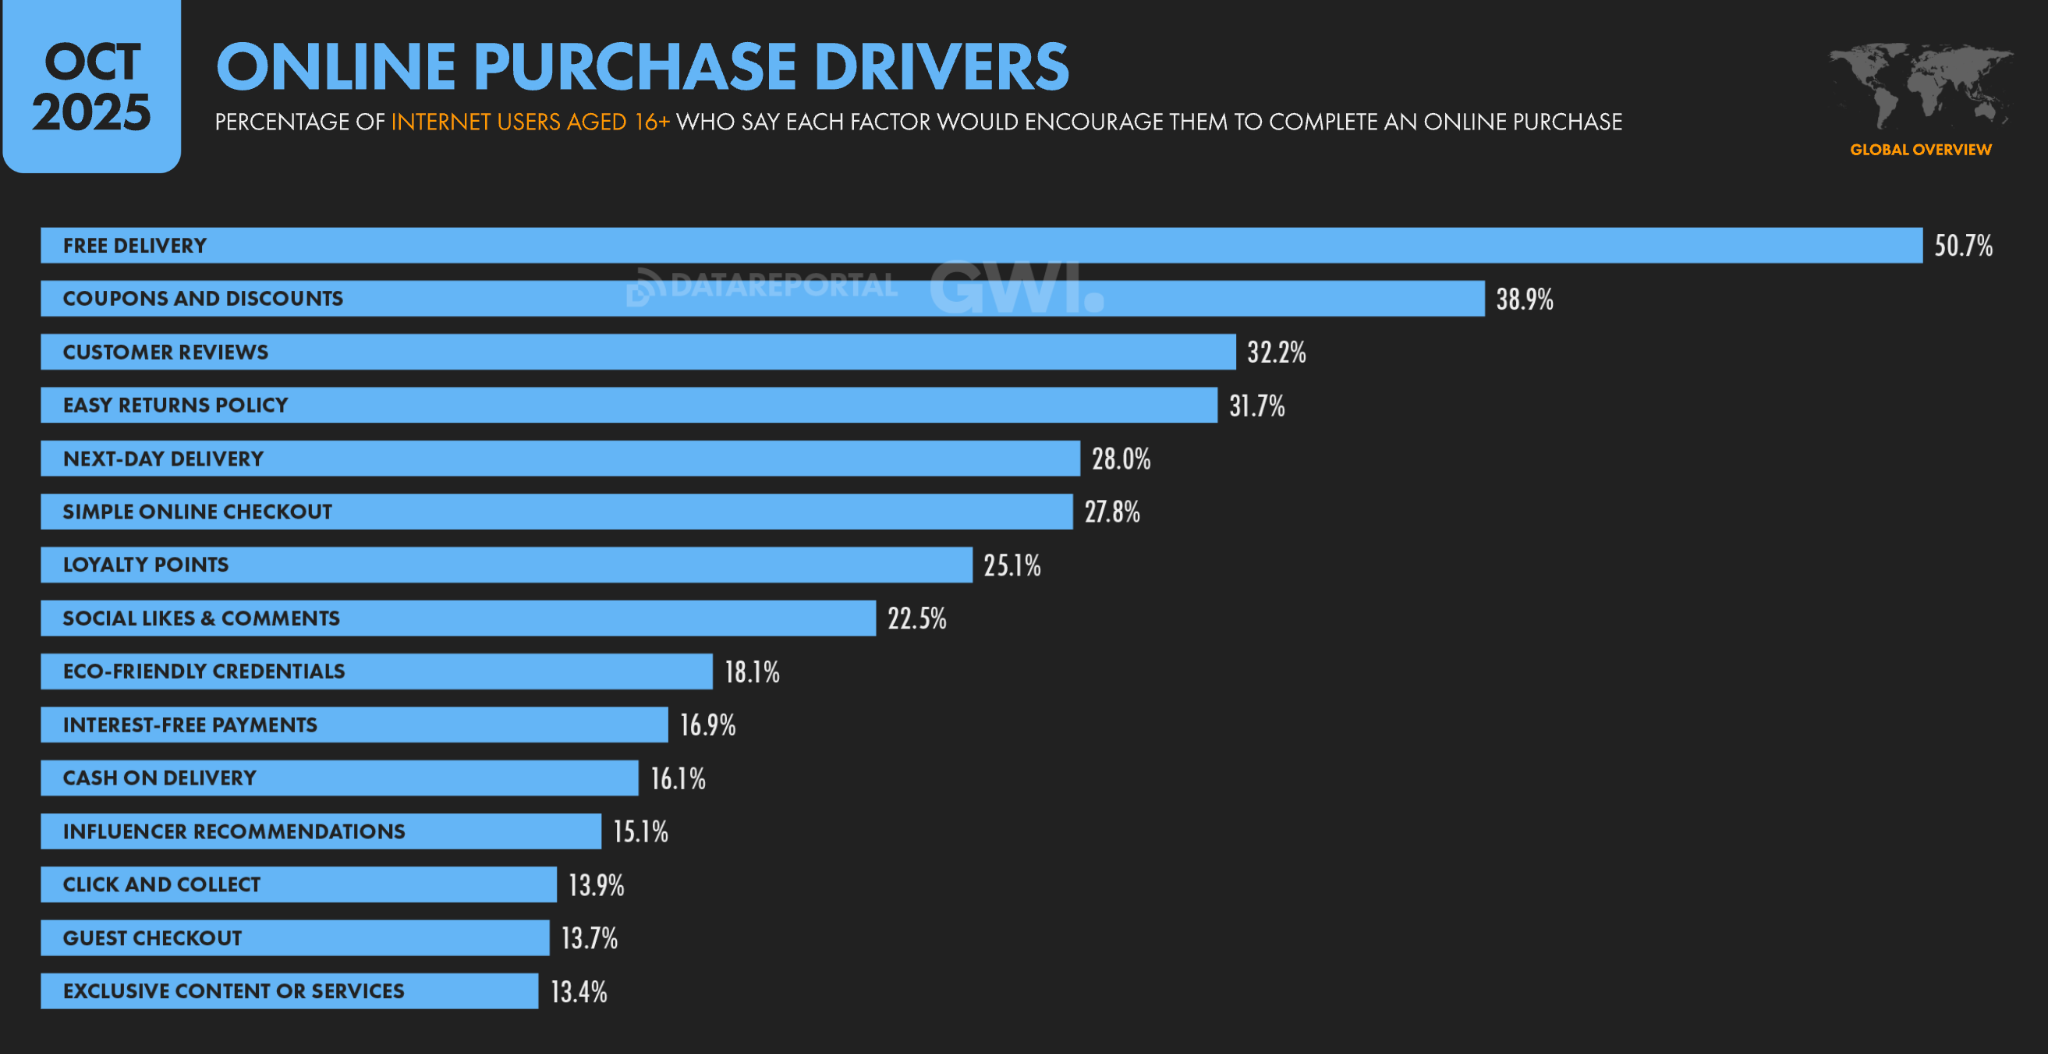
Free delivery was the biggest incentive for online shopping, with 49.6% of internet users aged 16 and older saying it would encourage them to complete an online purchase.
This was followed by:
- Coupons and discounts at 39%
- Customer reviews at 31.5%
- Easy return policies at 31%
- Next-day delivery at 27.2%
- Online checkout process at 26.7%
In the VML report, 61% of global consumers liked the idea of buying everything from one marketplace.
This extended to banking and financial products (45%), utilities (47%), and even using a dating app from a marketplace (42%).
The report also found that global consumers' marketplaces took the top spot across all other channels like search engines, social apps, or AI when it came to these stages of the customer journey:
- Inspiration – 22%
- Info gathering – 18%
- Search – 17%
- Purchase – 11%
In another 2026 ChannelEngine report that looked at 4,500 online marketplace shoppers across the US, UK, France, Germany, and the Netherlands, 37% of shoppers started their journey on marketplaces15.
Additionally, 39% expected their marketplace usage to increase, while more than 50% expected it to remain unchanged. Another 62% were open to shopping on new marketplaces, provided they researched them first.
In terms of browsing and product comparison, shoppers visited an average of three marketplaces before buying.
53% of shoppers compared the same product on various marketplaces before buying. Meanwhile, 95% noted price differences between marketplaces, with 13% saying the differences were often significant.
Price was a major factor influencing online marketplace purchases.
90% of online shoppers in DHL's report said they always looked for the best deal, similar to VML findings that price was the number one factor for 92% of shoppers.
In ChannelEngine's shopper report, lower prices (48%), faster shipping (36%), product availability (32%), and product variety (26%) were the most important factors when shopping on an online marketplace.
- Free shipping (91%), customer star ratings (83%), and verified buyer reviews (81%) were also key purchase drivers.
- 22% of shoppers in the VML report said their families were their biggest influence, followed by social media influencers (15%) and friends (14%).
Online shoppers were also heavily influenced by marketplace reviews.
Specifically:
- 83% of shoppers said ratings influenced their purchase decisions, while 81% were influenced by verified buyer reviews.
- 60% said they would hesitate to buy products without reviews.
At the same time, 43% of shoppers selected difficulty in assessing the quality of products as a key reason for not considering certain product categories on online marketplaces.
This was followed by concerns around authenticity (31%) and complicated returns 26%.
67% of online shoppers had abandoned their purchases because the delivery offering did not meet their expectations.
Meanwhile, 58% had abandoned purchases because the returns offering did not meet their expectations.
In VML’s report, 32% of shoppers expected their online orders to arrive in less than two hours.
The expectation was highest in the following categories:
- Grocery – 50%
- Health and pharmaceutical – 44%
- Financial products – 43%
40% of shoppers in the report also said they wouldn't order from an online store that could not deliver by the next day or offer scheduled delivery.
In separate findings in the VML report, nearly 50% of shoppers expressed dissatisfaction with their online shopping experience.
50% also felt businesses had no idea what customers wanted from their digital channels, while 45% said they often abandoned purchases because the experience was too frustrating.
According to DHL, 60% of shoppers worldwide bought from marketplaces in other countries to get lower prices.
Other reasons included:
- The product not being available in their own country – 44%
- Access to better quality products – 32%
- Better delivery and returns options – 23%
The same research found that 45% of online shoppers cited fraud concerns as a barrier to cross-border purchases.
Other barriers included:
- High delivery costs or long wait times – 45%
- Customs, duties, or taxes – 41%
- Complicated or costly returns – 36%
Social commerce marketplace statistics
As per a Momentum Works report, TikTok Shop generated $64.3 billion in global GMV in 2025, up 94% year over year16.
Southeast Asia accounted for $45.6 billion of this total, while US GMV reached $15.1 billion, up 68% from $9 billion in 2024.
In the same report, TikTok Shop's global GMV reached $50.3 billion in the first half of 2026, increasing 92% year over year.
US sales grew by 103% to $11.8 billion over the same period, making it TikTok Shop's largest national market.
TikTok Shop had approximately 803,500 stores and 15.4 million influencers in the US in 2025.
More than half of those stores recorded no sales during the year, while over 2,000 generated more than $1 million in GMV.
In the first half of 2026, more than 5,700 US TikTok Shop stores generated over $1 million in GMV.
This was 8x the number recorded in the comparable period a year earlier. Of these, 506 exceeded $10 million.
Facebook Marketplace recorded 430 million item listings per month worldwide in 2026, including 44 million vehicle listings17.
- More than 3.5 million listings were posted on Facebook Marketplace daily across the US and Canada in 2026.
- In the US alone, over 30% of young adults who used Facebook visited Marketplace daily.
According to the 2026 DHL report, 45% of online shoppers purchased through social commerce channels.
Meanwhile, 63% of ecommerce businesses sold through social platforms.
The share of global online shoppers who purchased through specific social media platforms was as follows:
- Facebook – 63%
- TikTok – 50%
- Instagram – 48%
AI and online marketplace statistics
The Marketplace Pulse report found that 83.4% of marketplace sellers used AI in at least one area of their business, averaging 3.2 use cases per seller.
Listing optimization was the most common application (63.5%), followed by image and video creation (49.2%). Advertising management was used by approximately 34% of sellers.
However, 25% of sellers said AI had not yet delivered a measurable positive impact on their business.
Another 25% identified listing optimization as the area with the greatest benefit, followed by content creation (17%) and advertising (9%).
Among marketplace shoppers in the ChannelEngine Report, 58% used AI tools to look for products.
ChatGPT was the most widely used tool (33%), followed by:
- Google's AI tools – 18%
- Gemini – 15%
Meanwhile, 11% had used AI assistants within marketplace platforms, and 10% had used Amazon Rufus.
The report also found that close to 50% of shoppers were open to purchasing products directly through an AI assistant rather than visiting a marketplace or brand website.
17% of all shoppers said they would be comfortable making purchases this way, while 32% would consider it for certain products. Another 43% preferred purchasing through a marketplace or brand website.
Between June 2025 and May 2026, online marketplaces received an average of 46.8 million monthly visits from AI referrals, up 237.3% year over year18.
Of the seven industries analyzed, including news, finance, and travel, online marketplaces received the most AI referral traffic. Average monthly visits increased from 13.9 million in the previous 12-month period.
AI referral traffic to online marketplaces increased from 33.2 million visits in June 2025 to 89.9 million in May 2026.
Between April and May 2026 alone, visits rose from 66 million to 89.9 million, an increase of 36%.
Create your online marketplace with Whop
Create your marketplace with Whop. Copy an existing marketplace by using a Whop Blueprint, tailor it to your business with simple prompts and Whop AI, and get your marketplace live in less than one day.
Whop handles payment acceptance, connected accounts, seller verification and payouts through one API.
You bring the idea. Whop brings it to life.
FAQs
What are the biggest challenges for sellers in today's online marketplace?
The biggest challenges for online marketplace sellers include intense pricing competition, rising marketplace fees, shipping and fulfillment costs, and managing product listings across multiple platforms. Sellers also face pressure to maintain profit margins while keeping product information accurate and consistent.
How do online marketplaces work?
Online marketplaces connect buyers with multiple independent sellers through a single platform. Sellers list their products, set prices, and fulfill orders, while the marketplace facilitates product discovery and purchases. Marketplaces typically earn revenue through seller commissions, advertising, listing fees, and other services.
What are the top 3 online marketplaces?
Amazon, Pinduoduo, and Douyin/TikTok are the world's three largest online marketplaces by gross merchandise value (GMV). Amazon leads globally, followed by China's Pinduoduo and Douyin/TikTok.
Sources